Industrial Laser Systems: For Industry 4.0
For bloggers
Do you want to manage all news about Industry 4.0?
you manage the blog, you earn the money. Contact us here mayado@sylodium.com
For companies
Make business in all bilateral trades. Specially from American blocs to Africa related with Future business, specially in all Industry 4.0, 3D Printers, laser business, AI business, Virtual Intelligence, R&D etc.
For institutions
South –South Trade, the richest countries in commodities, the future of international trade World.
Tap Sylodium (contact us for synergies) to rotate your country in Internet (step by step) promoting American-African relations
This new is from LaserFocusWorld
Industrial Laser Systems: For Industry 4.0, visualization and machine learning can be combined to enhance laser processing
The iV Model combines process data with image and video data in a workflow architecture that allows a user to see all related sources and apply analytical tools such as images, plots, numerical results, and filters.
TONY LOTZMANN, FELIX WENZEL, UDO KARSUNKE, and KAROL KOZAK
In the rapidly growing arena of laser system technologies, large amounts of data are generated, captured, and maintained during manufacturing processes. A critical need exists to analyze and make strategic decisions based on the historical data, and to update the existing data to support the current needs of the processes.
The Industry 4.0 (or Industrie 4.0) trend enables a vision for the factory of the future based on automation and data exchange that will change the way laser processes are optimized. Laser-based processes must become more intelligent to extract maximum efficiencies and power. Data visualization must work with the human visual system to provide fast access and quick reaction during processing, and an understanding of problems in multi-parametric, heterogenic data spaces.
With this goal, classical and novel machine learning in combination with visualization techniques play a very important role. This article will describe a concept that combines interactive visualization with machine learning techniques called the Intelligent Viewer (iV) Model for analyzing laser process parameters applied for welding, joining, cutting, bonding, cladding, coating, and printing.
Interactive visualization with machine learning
Industrial laser systems are very complex in terms of both data acquisition and data processing (see Fig. 1). Technological advances are constantly increasing the size and complexity of sensor, log, image, and video data resulting from the aforementioned industrial laser processes. And because environmental changes and uncertainty are inherent to the process, the data flow cannot be controlled by manual methods.
 |
| FIGURE 1. Laser process data flow and intelligent analytics are optimized in the development laboratory and routinely applied in production. |
Consequently, it has become essential to automatically track the kinds of errors and critical parameter values that can occur during laser processing. Application of interactive visualization combined with multi-parametric algorithms is a feasible approach to this problem.
An interactive visualization1, 2 system provides users with the integrated interface needed for analysis. Discovery tools that combine visualization and machine learning can then enable more effective data analysis while preserving user control.3

The field of machine learning is concerned with the development and application of multi-parametric computer algorithms that improve as the quantity of data increases.4 Machine learning, which is also known as artificial intelligence or pattern recognition, is a field at the intersection of computer science and statistics, and it is the process that attempts to discover patterns in large datasets.
Consequently, machine learning has the potential to enable computers to assist in the analysis of process parameters and the complex data produced by manufacturing process. The scalability of traditional visualization methods on machines for complex laser-based process data is an issue: the end user is limited to interpreting between two and three dimensions. In addition, the computational burden of many visualization methods is too large for real-time interactive use with large process datasets. To address these scalability issues and to enable visual data mining of massive sets of high-dimensional data ("big data"), intelligent visualization methods are needed.
Machine learning can begin to quickly understand assets and the causal relationships between all the existing signals and parameters that affect laser processes and potential failures. Interactive visualization and machine learning can then build a model of reliability and performance that can monitor real-time performance and identify when asset performance begins to deviate from the norm.
Such an interactive solution can be used to trigger appropriate interventions and corrective system actions. In the following sections, we will present the iV Model used to combine interactive visualization with machine learning techniques for Industry 4.0 processes.
A laser cladding process example
Machine learning is most useful for predicting and defining border process parameter values in large process datasets, and has been used for real-time and post-processing analysis. Machine learning methods can be divided into two types: supervised or unsupervised classifiers. Supervised methods are trained on labeled examples and then used to make predictions about unlabeled examples, whereas unsupervised methods find structure in a dataset without using labels.
We will focus on supervised methods because the primary and expected parameters values are known (the so-called training dataset) from experiments and the process development stage. The training data consist of a set of known parameter values trained in the laboratory where the process has been developed.
In supervised learning, each example is a pair consisting of an input object (typically a vector) and a desired output value (also called the supervisory signal). A supervised learning algorithm analyzes the training data and produces an inferred function, which can be used for mapping new examples. An example of a supervised classification process is shown in Fig. 2.
 |
| FIGURE 2. In machine learning, a supervised classification process determines critical values for process parameters. |
To demonstrate the process, we consider an application to identify the unexpected parameter values in a laser cladding process (an outlier according to experimental settings) within all the parameter data that was generated during the process period. First, a machine learning researcher develops an algorithm together with a process designer that they believe will lead to successful learning.
Second, the algorithm is provided with a large collection of empirical process parameters in norm (top/down critical values), as well as, optionally, a list of parameters of the process that are known not to be out of range (outliers). The annotation indicating whether a process parameter is an outlier is known as the label. The algorithm processes these labeled parameters and stores a model.
Third, new and unlabeled parameter values are provided to the algorithm, and it uses the model to predict labels (in this case, norm or outlier) for each process parameter. If the learning is successful, then all or most of the predicted labels will be correct.
Analysis process in interactive visualization
Process data include information about the temperature, environment, and power, logging up to several million thermal camera images, as well as image analysis results with more than 100,000 rows and more than 20 columns. The use of any data analysis tool requires the researcher to appropriately tune these parameters for a specific dataset to avoid arbitrary results in terms of the number of data clusters, size, or density.
Interactive visualization can spur process discovery and development of computational methods by facilitating this transformation. Existing process data and information visualization techniques have been adapted to create tools with easy-to-use interfaces that complement a whole range of computational methods, allowing easy interpretation of process parameters.
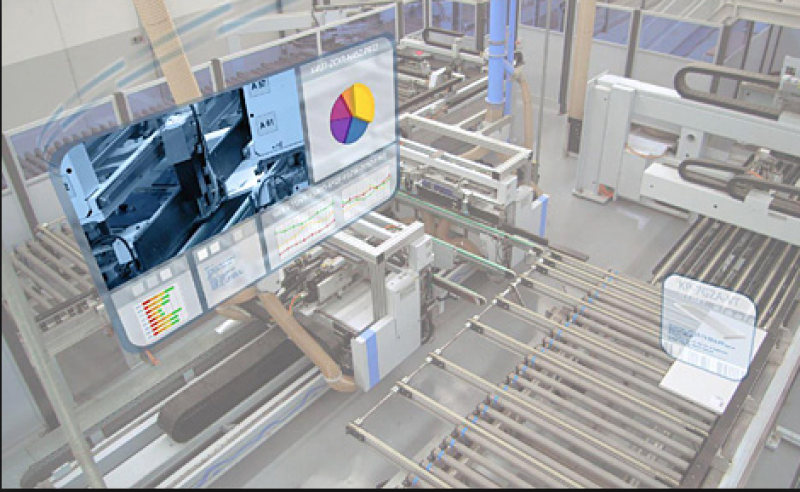
By combining the data from the laser-related technology installed on diverse machines and controlled by a monitoring system that includes sensors for power, temperature, log files, speed, and bus system signals, the system can reduce exposure to risk, collaboratively improve quality, and perform root-cause analysis faster and more accurately. Through a simple interface with a one-click, one-view concept, and a workflow-based architecture, the visualization method facilitates the linking of process data with image and video data (see Fig. 3).
 |
| FIGURE 3. The integration of machine learning and visualization enables interactive coordinated visualization. |
The basic idea of interactive visualization is to provide the data in one visual frame that allows users to gain insight into process parameters by directly interacting with image and video data. The advantage of interactive visualization is that users are directly involved in all the data channels of the process, and can combine the flexibility, creativity, and general knowledge of the operators with the enormous amount of numerical rows connected to sensors and log files.
In the iV Model, data can be visualized at several stages of analysis and linked to raw image and video data, keeping the concept of a star model (see Fig. 4b): one-click, one-view. In the iV Model, the labeled classes from machine learning are integrated and demonstrated as norm or outliers. Unmodified and transformed datasets can be plotted interactively as scatter plots, displayed in histograms, viewed in an image viewer/editor, or viewed as tables. Entire experiments can be displayed in various overview plots in the context of how they are annotated, and figures and tables can be exported for publication.
 |
| FIGURE 4. Traditional vs. interactive visualization of the analytics process, where a traditional, time-consuming analytics process for process datasets requires multiple clicks, folder searches, and manual data linkage (a), while the interactive method uses one panel and with one click or slicer, the user see all related data sources and analytical tools (e.g., images, plots, numerical results, and filters). The concept is that access to all information should be direct and that user actions should be minimized (b). |
This interactive visualization concept will be able to deal with changing process and environmental conditions that often occur in industrial laser processes. The combination of both approaches-interactive visualization and machine learning-promises to provide a method for parameter assessment and real-time analysis.
Here, we have described an architecture of interactive visualization and machine learning to ensure that computation will be fast enough for parameter assessment. To our knowledge, this is the first demonstration of an interactive visualization combined with machine learning to be described for laser application in Industry 4.0 processes.
REFERENCES
1. M. Baldonado, A. Woodruff, and A. Kuchinsky, "Guidelines for using multiple views in information visualization," Proc. ACM Advanced Visual Interfaces, 110-119 (2000).
2. M. Derthick, S. Roth, and J. Kolojejchick, "Coordinating declarative queries with a direct manipulation data exploration environment," Proc. IEEE Information Visualization Symposium, 65-72 (1997).
3. B. Shneiderman, Inf. Vis., 1, 1, 5-12 (2002).
4. T. Mitchell, Machine Learning, McGraw-Hill, New York, NY (1997).
Tony Lotzmann, Felix Wenzel, and Udo Karsunke are all with Fraunhofer IWS, Dresden, Germany, while Karol Kozak is head of the Imaging Processing & Data Management Group at Fraunhofer IWS and a professor at the Wroc?aw University of Economics, Wroc?aw, Poland; e-mail: karol.kozak@iws.fraunhofer.de; www.iws.fraunhofer.de.